Goal:
Identify concepts, general features, or functionality of Junos platform automation
-MGD-based automation (Utilises XML API and REST API)
-Telemetry concepts (e.g., gRPC/gNMI/native (network management interface))
-JSD-based automation (Utilises the JET API)
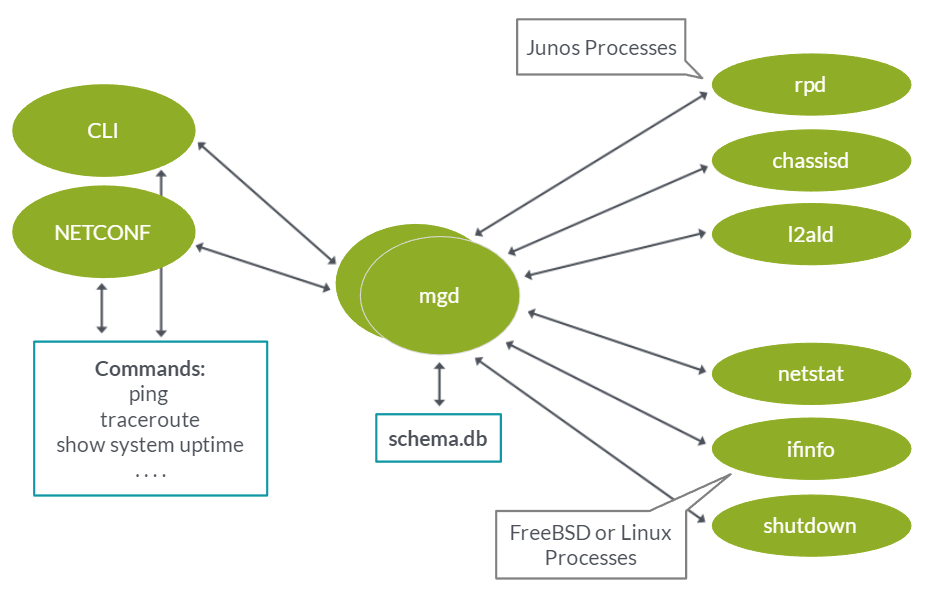
mgd-based automation
1- The cli and netconf messages interface with the mgd.
2- mgd checks against the schema.db file, verifying accurate syntax and semantics
3- Once verified the mgd queries Junos processes (rpd, cosd.etc) and BSD/Linux processes (ifinfo, netstat.etc) and these processes return information in XML format to the mgd.
4- If speaking to netconf mgd will return the raw xml information. If speaking to the CLI it will first use the ODL (output description language) to format it and make it more human readable.
More Notes
The most important services for Junos Automation are the jsd process and the mgd process.
The mgd process is fundemental to any netconf based automation on Juniper devices.
Netconf is used to access the Junos XML API over a network. (RFC6241)
It usually uses SSH as a transport layer but TLS is also usable with netconf.
REST uses https for transport. It’s a stateless protocol, realtively easy to set up and does not require NETCONF.
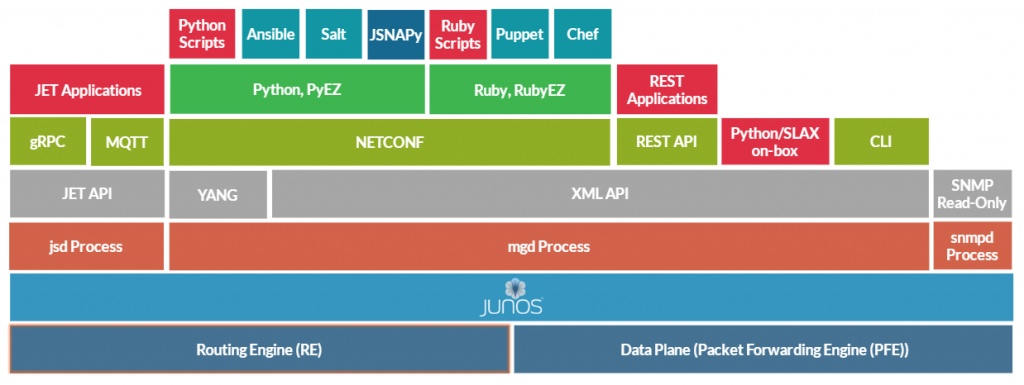
The Junos UI Infrastructure
mgd: handles input coming from the CLI as well as from NETCONF sessions. The mgd validates that the syntax of the commands and configuration data is correct. The mgd then calls appropriate internal processes as needed to execute operational mode commands or modify a configuration.
The mgd consults the schema located in the schema.db file whenever a configuration is parsed or exported, a CLI user uses auto-completion or a configuration database is read by a Junos process.
Schema: UI Schema defines the hierarchy of the Junos OS configuration. Also contain the details of all Junos OS operational mode commands and related arguments and options that can be executed along with them. Every possible configuration option and the Junos OS commandis contained within the schema.
This is called the schema.db file, and is defined using ddl.
Configuration Database: Junos Configuration Database stores Junos configuration. There is more than one instance of the configuration database in addition to a text version of the configuration.
CLI: CLI process hosts telnet, ssh and console connections, forwards user input to the mgd and performs formatting and displaying of information returned back from the mgd based on the ODL definitions. Although it is considered part of the UI it should not be used for automation.
When a user issues a command through the CLI or NETCONF the command is passed on to the mgd queries the schema that resides in the schema.db file and validates the command. Once it is validated the mgd executes the command.
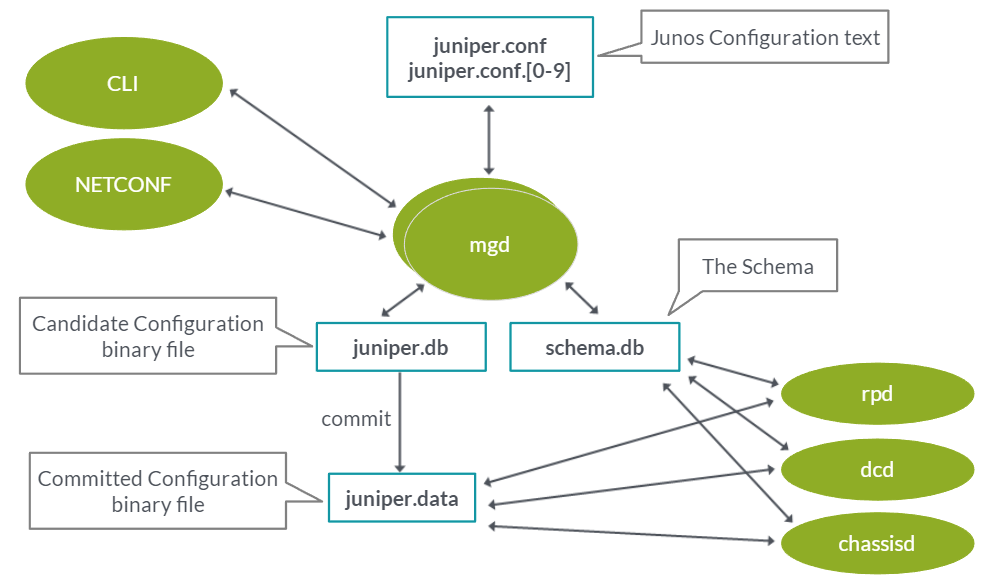
When Junos OS boots it first loads the text based config file juniper.conf as part of the load process the Junos OS has to validate the configuration against the schema in the shcema.db file. If validated configuration is compiled and stored in the juniper.data file for fast lookups, which is a read only file.
When the user enters configuration mode, a candidate copy of the configuration is placed in juniper.db, and the user edits this file.
When a user or remote session commits a configuration, the mgd validates the contents of the juniper.db file against the schema stored in the schema.db file. If the mgd finds an error, the error is reported and the commit fails. If the changes pass validatrion the mgd notifies all affected processes, and the candidate configuration in the juniper.db file becomes the active configuration, which is stored in the juniper.data file. Finally the rollback file is created.
Junos DDL and ODL languages
These data languages are at the core of the Junos XML API and UI. The Junos Schema is implemented using the DDL and ODL languages. Users don’t interact with the DDL directly, it used by Junos programmers.
The DDL files are loaded at device boot and become the shcema. No additional layer/process is added to the shcema.
XML name is added to the DDL file when a feature is created. This is all that needs to be done to make a feature available for automation.
The ODL is similar syntaxically to the DDL but has a different purpose. It takes the XML responses to commands and informs the CLI how the information should be displayed. It’s responsible for making the output of CLI commands human readable. Users do not act with this directly (These sound fun to dissect and hack on a device)
Off-Box automation using NETCONF
NETCONF Libraries make programming easier. It still requires users to form XML requests and parse CML responses in code.
Junos PyEX is an open source Python framework with an easy learning curve. Allows you to automate all elements of configuration, monitoring, software upgfrades and file system maintenance. Allows you to read and upload device configuration in a number of formats. (text, xml, json and junos set commands)
PYEZ THING TO TRY – You can use the tables and views feature to move objects from XML into a python object?!
On-box scripts and XML API
The following programming languages can be used for on-box scripting:
XSLT – Extensible Stylesheet Language Transformations (developed by w3c)
SLAX – Stylesheet Language Alternative Syntax (syntaxically similar to c and perl, content in this open source language gets converted to XSLT)
Python – on-box python scripting supported since junbos 16.1. includes on box PyEZ.
There are four types of on-box scripts you can develop:
Commit Scripts: Commit Scripts run every time a user commits the configuration. They can enforce custome configuration checks, automatically fix configuration mistakes, and dynamically expand the configuration.
Op Scripts: Can be run from the command line, essentially working as custome operational commands. You can use op scripts to execute operational commands, create custom commands, perform basic troubleshooting tasks or perform controlled configuration changes.
Event Scripts: Similar to op scripts, except they are initiated by an event policy. Feature lets you have the software automatically respond to events that it logs, such as interface state changes or BGP neighbour state changes.
SNMP Scripts: Triggered automatically when the SNMP manager requests information from the SNMP agent for an object identifier (OID) that is mapped to an SNMP script for an unsupported OID.
Automation Management Sustems
Benefits of using an automation management system:
– Scale by managing mulitple devices at the same time
– Provide declarative way to program your network
-You describe the desired state, automation system does the job
-No low-level coding required
-Support Configuration templating
-Render templates to create configurations and upload them to devices
-Operational state collection
-Common Maintenance Tasks
-Some platforms enable to take actions based on events
XML API (NETCONF) is a common communication method
JSNAPY – Junos Snapshot Administrator in Python
-Captures and audits devices running the Junos OS
-Takes snapshots of the system when working, and then again after a change has been made / test case to ensure the system meets the defined criteria.
-Used to audit environment against a predefined criteria
-Python version of JSNAP (which uses slax)
-JSNAPY is open source!!
JET
-Provides a modern, programmatic interface for developers
-Provides standards-based interface to the Junos OS
-Exposes internal APIs for automation
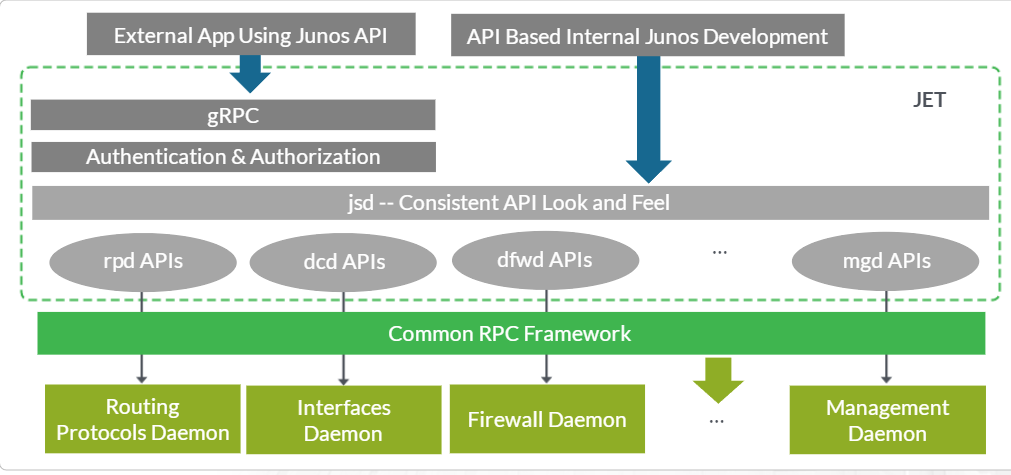
JSD supports an additional set of API’s for automation. The JSD process aggregates the internal APIs belonging to the Routing Protocol Daemon process (rpd) as well as the dcd, dfwd and mgd api’s.
It uses the gRPC protocol instead of NETCONF
Jet API gives users/devs another set of APIs to use for automation. Benefits include faster commit times, improved device telemetry and a wider range of possible languages available for automation. The JSD exposes users to the same APIs that Juniper programmers use for internal development.
On Box JET applications can be developed in Python and C++
Jet for Junos uses a remote procedure call (gRPC) framework
The gRPC server is part of the jsd which runs on the Junos OS.
For event notification JET uses the MQTT (Message Queue Telemetry Transport) protocol.
Event notification is implemented through the moquitto notification broker.
To keep up with rapid config changes that automation systems make on the Junos OS the JET includes the FAST programmatic configuration feature (often referred to as the ephemeral database), which can commit over a thousand changes per second. These commits are not validates, which is where the time is saved. This means that you need to be certain the app is pushing a valid configuration.
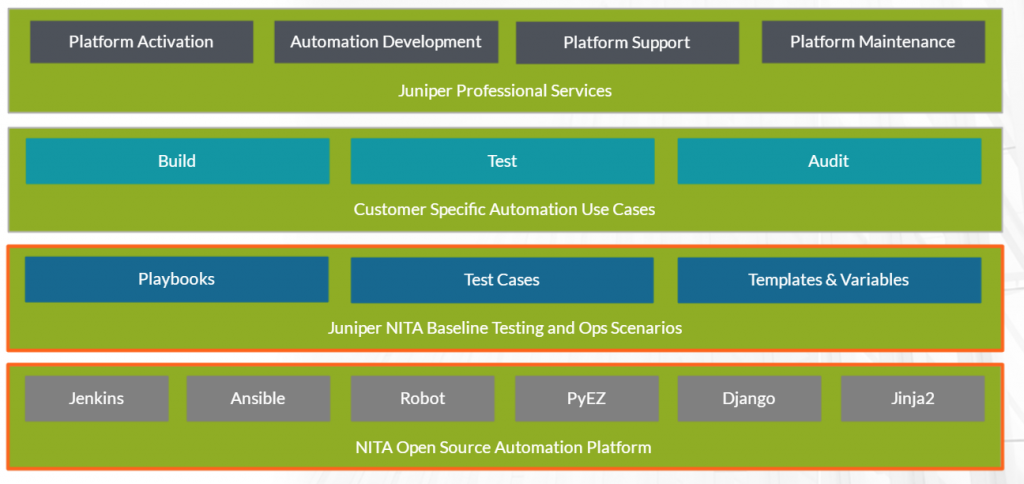
NITA – Network Implementation Testing Automation
-Implements Testing and Deployment stages of DevNetOps pipeline.
-Automation framework based on open source software components, including Ansible, Robot Framework and Jenkins, as well as Juniper developed libraries of test cases and best practice automation scripts.
-It is implemented and supported by Juniper Professional Services and in 2020 it was made open source!! It is robust and well tested and can be utilised for test driven development.
-It can be used to build test cases.
It was designed with several use cases in mind:
-Automated Lab Testing (ALT) – ALT tests are executed on preproduction environments to verify the impact of changes to the current configuration, plan future system expansions, or integrate new products.
-Automated Deployment (AD) – The configuration files can be created and pushed to mulitple network devices, increasing the systems agility and operational efficiency.
DevOps for networks:
For the purpose of this certification and general clarity:
Dev: What you create directly and store in your version control system
Ops: What is actually provisioned on the devices
Telemetry is the process of collecting and pushing data on device performance to a process that can act on it.
Using telemetry data to diagnose problems automatically
Using automation extensive telemetry and log data can be collected from network devices. Automated telemetry analysis can the be performed and in some cases the issue can be detected, and automated root cause analysis can be performed without human interaction.
Example pipeline:
1- Design Change: Based on a business requirement and customer feedback a change is needed in the network (e.g. engineer wants to increase reference bandwidth of OSPF protocol from 10g to 100g on all devices in a network)
2- Commit Change to VCS: The change, in the form of a block of code is committed to VCS. (The configuration template for the OSPF protocol is modified and this modification is committed to Git repository and a pull request is created)
3- Notify and Peer Review: The team is notified of a proposed change, typically using slack,, and team members review and approve the change.
4- Automated Testing: Once the change is approved tests run automatically, ideally in a seperate testing (staging) environment. At this stage you can use tools like JSNAPY (Junos Snapshot Administrator in Python) or Robot Framework.
5- Automated Deployment (AD): The change is committed to production. Process can be managed using Jenkins Pipeline or a similar tool.
6- Continuous Monitoring: Network Telemetry is collected and analysed to get feedback. This feedback to SLI’s (Service Level Indicators) is used to make adjustments to the transistory network state. (e.g. relevant KPI’s include traffic levels on any interfaces that have OSPF enabled.)
7- Continuous Improvement: If failure occurs the system rolls back fast to a known good state. The engineers record the lesson in a lessons learned knowledge base.
Network Reliability Engineering
Utilising DevOps ideology to ensure reliable network operations.
-Focus is on customer satisfaction and service availability.
-Relies on proactive testing, not hope.
-Understanding that networking is inseperable from its connected systems and applications.
-Embrace failure, ensuring the same error does not happen twice.
-Establish simplicity in operations and management.
-Solves complexity with a well-codified source of truth and automated responses.
-Is a never ending journey.
Basic behaviours of Network Reliability Engineers:
1- Codify: From day 0 (once you have acquired the network software and hardware systems) an NRE codifies the network software artifacts, secrets and configuration into source code repositiories similar to what a software developer would do.
2- Automate: Using a DevNetOps pipeline, an NRE automates both testing and production deployments. NRE also uses this pipeline to engineer in-production reliability, scale, efficiency optimisations, dynamic provisioning of network resources for its consumers, and systems integration.
3- Test: Through automation, staging and stress-testing, and NRE ensures that the deliveries are reliable enough to meet Service Level Objectives (SLO) and Service Level Agreements (SLAs)
4- Monitor: An NRE monitors service-level indicators (SLI’s), both manually and automatically with analytics that trigger automatic responses and alerts for both anomalous and statistically meaningful events. Logs and telemetry are collected and analysed to derive efficiency insights, to plan and automate capacity needs.
5- Measure: The NRE culture values truth and transparency, and uses indicators to measure their effectiveness in meeting reliability goals, such as the mean time between failures (MTBF) and mean time to resolution (MTTR).
6- Improve: Permanently improve the stability of the system, the visibility of the system, and the reaction time to system incidents.
Moving from manual ops to automated workflows
-Adopt an automators mindset. Be a builder and a technologist, not a technician.
-Take documented workflows and automate them. At this stage it can be any ad hoc workflow to cut one’s teeth coding and using new tools for speed, scale and consistency.
-In addition to using the CLI documentation, explore the API documentation for individual systems.
-Find tools that already exist and dissect them. And build those that are customised and contextual to NetOps workflows.
-Relaise the value of abstractions and SDN (Software Defined Networks) so that the recreation of automation at the box-to-box or lower levels foes not have to occur unnecessarily where proven systems exist. Automate on top of them.
Moving from Automated Workflows to Automation, Test and Network as Code.
-Progress beyond an ad hoc automation. Begin to practice as-code and ‘GitOps’ developer-like behaviours. Code means codifying, not necessarily programming. Use Software Configuration Management (SCM) workflows and a versioned source of truth for all artifacts, configurations, and creations.
-Configuration is not distrubuted and perpetually drifting, but codified and its changes are reviewed, as are programmed automated workflows.
-Begin to think proactively of how to eliminate mistakes and mangual triggers with both testing and sensors.
-Start triggering tasks of Step 2 automatically rather than manually. Thus, begin automating in the ‘the this then that’ fashion.
-Use APIs and data from systems like Juniper AppFormix or other telemetry collectors and analytics systems in
1- Observability and devision making, moving to NRE SLI tooling
2- Proactive testing instead of relying soley on reactive troubleshooting
3- Automating ‘if this’ sensors
Moving from Automation, Tests and Network as Code to Continuous Processes on a Continuous Pipeline
-Adopt a QA and Testing mindset in making all changes, automating not only consistency, but accuracy as well.
-Insert testing processes in between “as code” and deployment on a DevNetOps pipeline.
-Move towards expediting more frequent deployments without maintenance-window woes because of higher confidence in automated change testing.
Moving from Code to Continuous Processes on a Continuous Pipeline
-Evolve tooling and thinking to NRE/SRE concepts.
-Ensure operations culture, observability, and planning is data driven.
-Seek to understand system efficiency, effectiveness, and satisfaction to customers (for example, the up-stack IT organisation or a service provider’s actual customers).
-Use chaos engineering and experimentation to understand system boundaries, limits, and dependencies to optimise and plan for capacity and what-if scenarios